Statistics
Electricity
Capacity
Scotland’s renewable electricity capacity has shown steady growth between 2009 and 2020 with an average annual capacity increase of over 700MW since the end of 2009. In 2022, renewable capacity installed was up 1,621MW up from 2021, the greatest increase in at least 15 years.
Chart 1: Total Installed Capacity of Renewable Electricity in Scotland 2009-2022
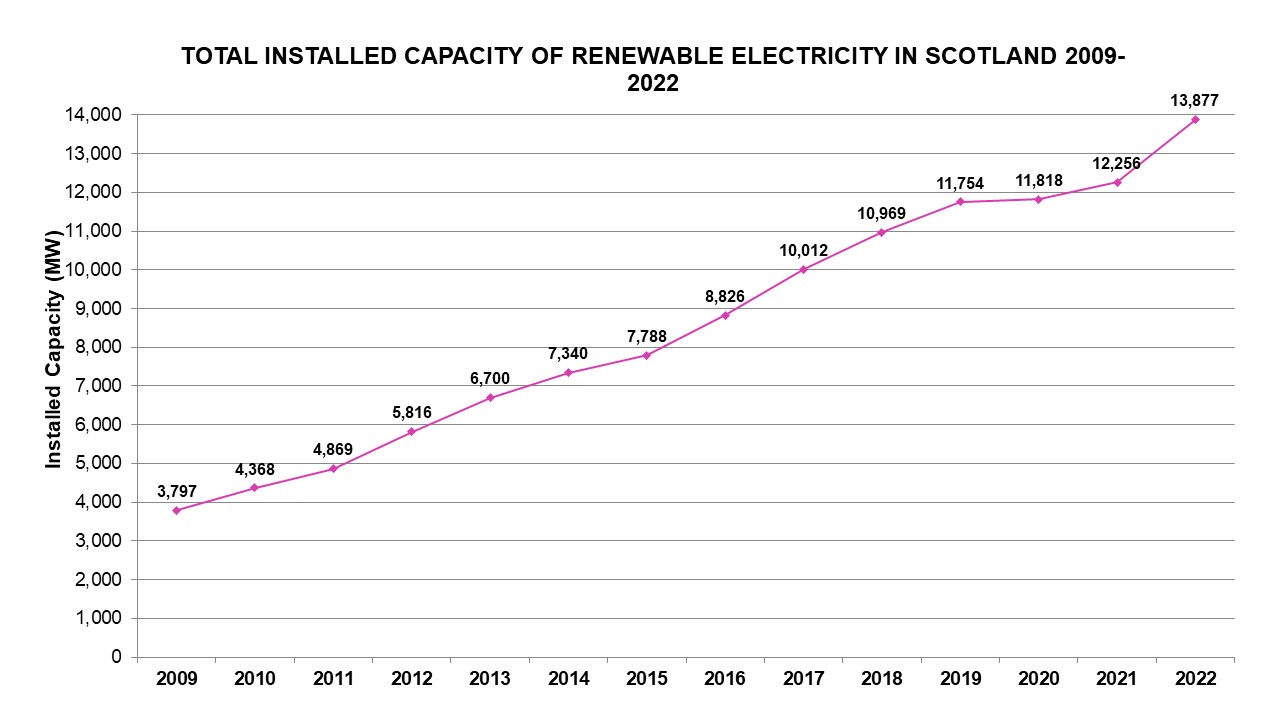
Source: Historic Regional Statistics and Department for Energy Security and Net Zero Energy Trends
Chart 2 sets out the current mix of renewable electricity generation capacity in Scotland. With the total now over 15GW, the sector is over four times bigger than it was at the end of 2008. Onshore wind is the biggest single technology, accounting for 62% of installed capacity, increasing by 748MW in the last 12 months. Offshore wind, hydro and solar photovoltaics are Scotland’s other major renewable power sources. Installed offshore capacity has increased rapidly over the last few years, with capacity increasing by 897MW in the year.
Chart 2: Current Installed Capacity of Renewable Electricity (Q3 2023)
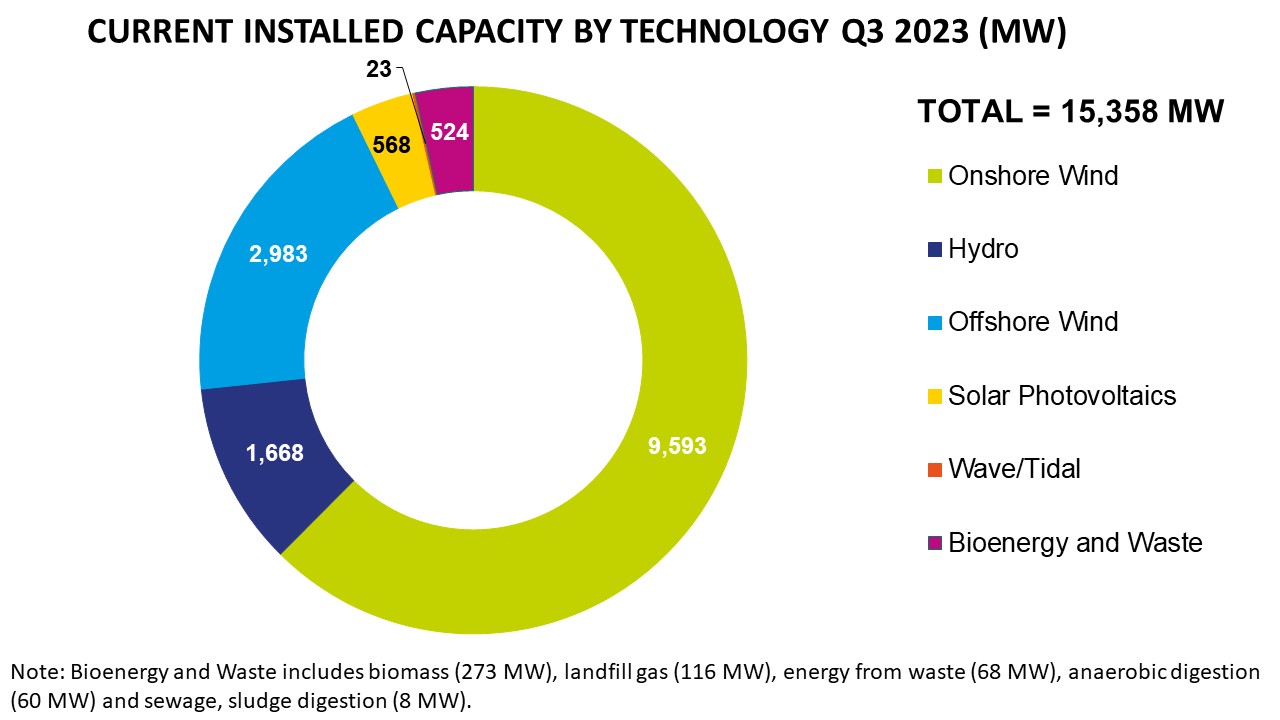
Source: Department for Energy Security and Net Zero Energy Trends
Output
The growing capacity of renewables has translated into a significant increase in renewable electricity output, which has more than quadrupled from 8,003GWh in 2007 to 32,063GWh in 2020.
Chart 3 shows that renewable electricity generation is now equivalent to approximately 97% of Scotland’s gross electricity consumption*.
*Gross electricity consumption refers to total electricity generation minus net exports
Chart 3: Electricity Consumption and % Renewables Output
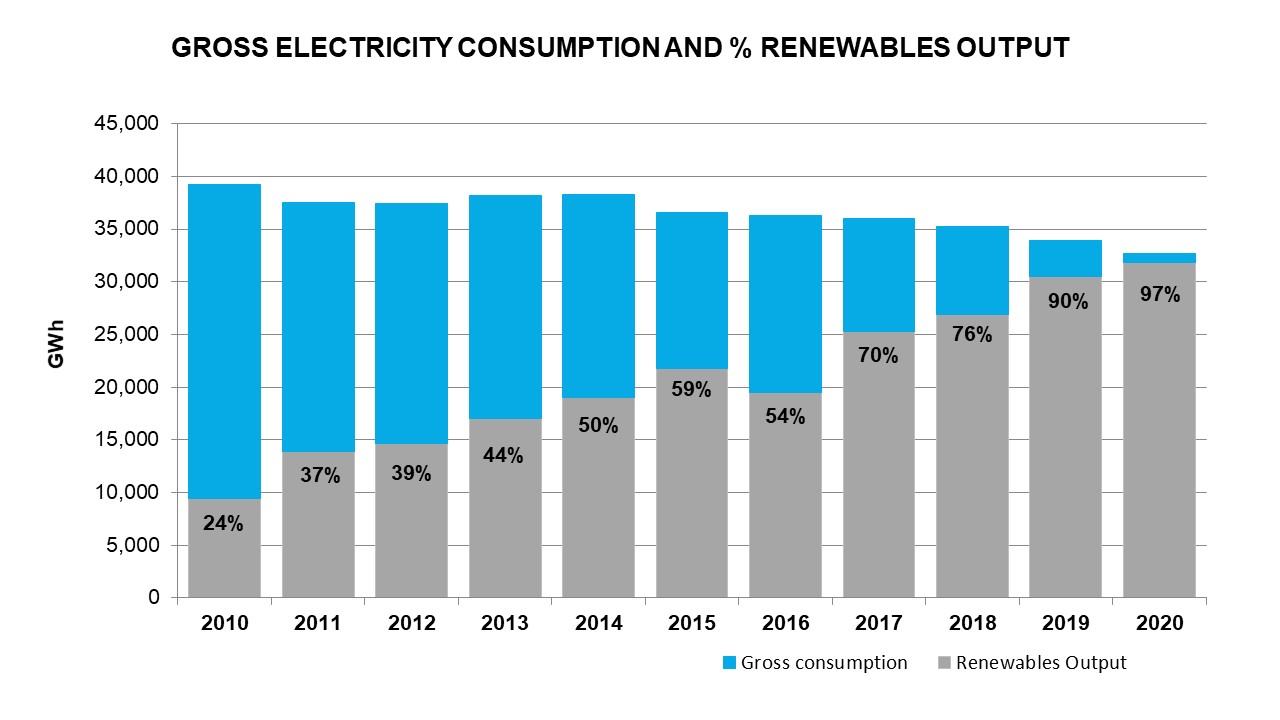
Source: Scottish Energy Statistics Hub
Chart 4 shows output from different sources in 2022. Wind-generated 78% of all renewable electricity output in Scotland.
Hydropower contributed around 12% of renewable electricity output. While other technologies such as biomass and marine energy currently make a smaller contribution, they have massive potential for growth in the future.
Solar generation is up 127GWh in the last year, the biggest annual increase since the DESNZ Energy Trend records started in 2009.
Chart 4: 2022 Renewable Electricity Output by Technology
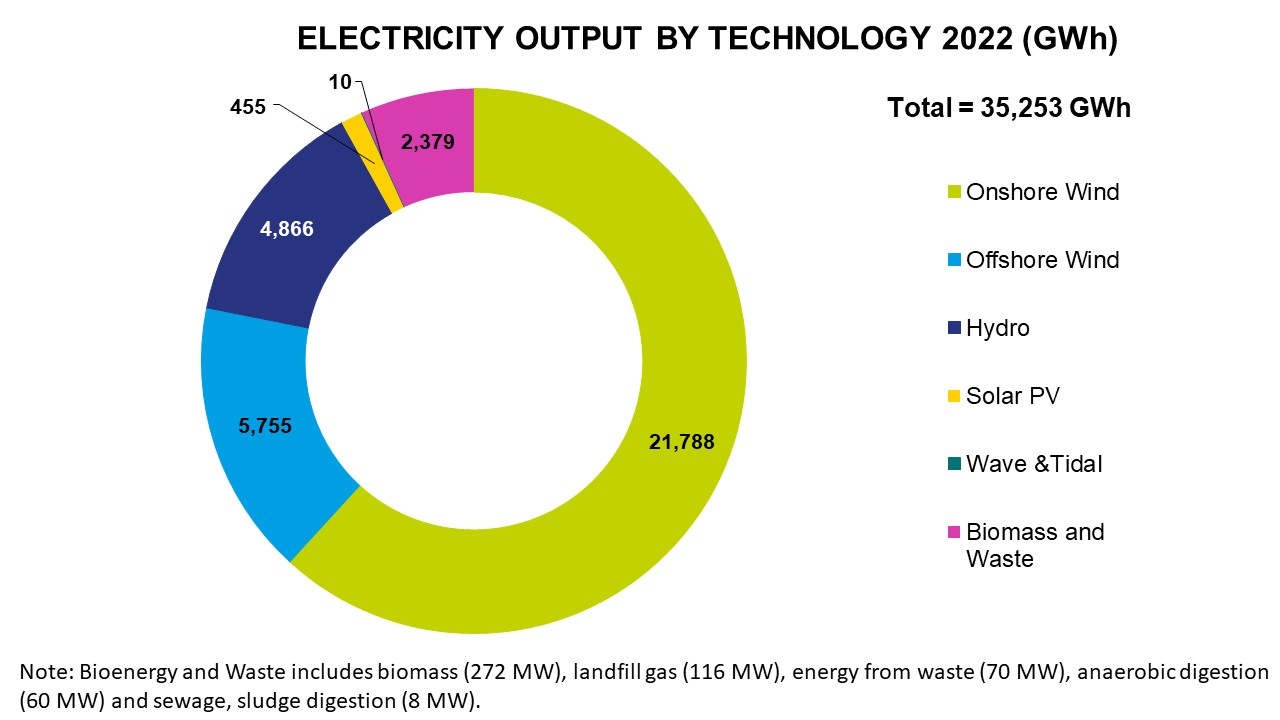
Source: Department for Energy Security and Net Zero Energy Trends
Chart 5 shows that the proportion of the country’s power generation from renewables has also grown significantly in recent years. The 2021 figures show that renewables were once again the single largest contributor to electricity generation in Scotland.
Chart 5: Electricity Generation in Scotland by Fuel 2010-2021
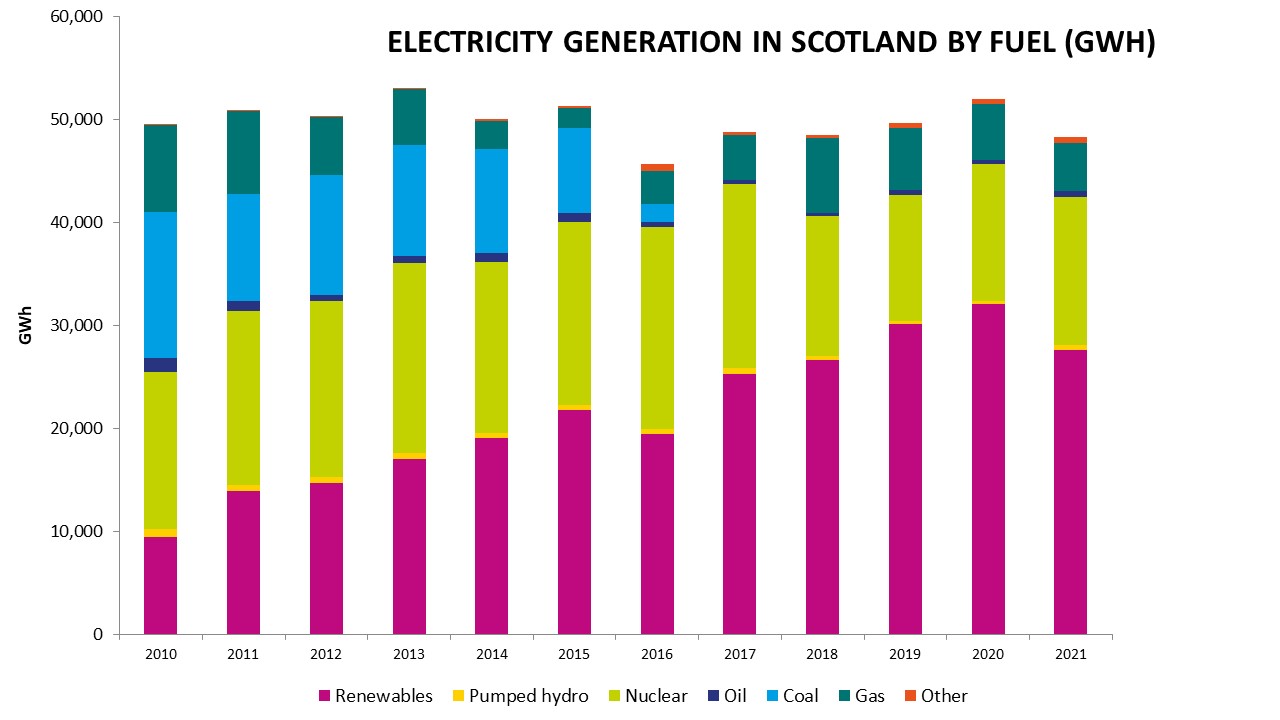
Source: Scottish Energy Statistics Hub
Planning Pipeline
There is significant additional capacity in development across Scotland, with projects either in planning or already consented totaling almost 26.4GW. Capacity increases in the short term will come from onshore wind, with 6.7GW of capacity already consented and a further 7.2GW in planning. Offshore wind has 3GW already consented with an additional 6.6GW in planning. There is also 1.8GW of solar projects at various stages of development and 291MW of wave and tidal projects either in planning or already consented.
Chart 6: Pre-operational Capacity of Renewables Projects Q1 2024

Source: Scottish Energy Statistics Hub
Heat makes up more than half of the energy used in Scotland, and therefore decarbonising this energy sector will play a huge role in meeting net zero by 2045. At present, the pipeline includes 1,545 future customer connections for air source heat pumps currently in the planning process and has a total of 1,198 customer connections awaiting or currently under construction from air, ground and water source heat pumps.
Chart 7: Pre-operational Capacity of Heat Projects Q1 2023
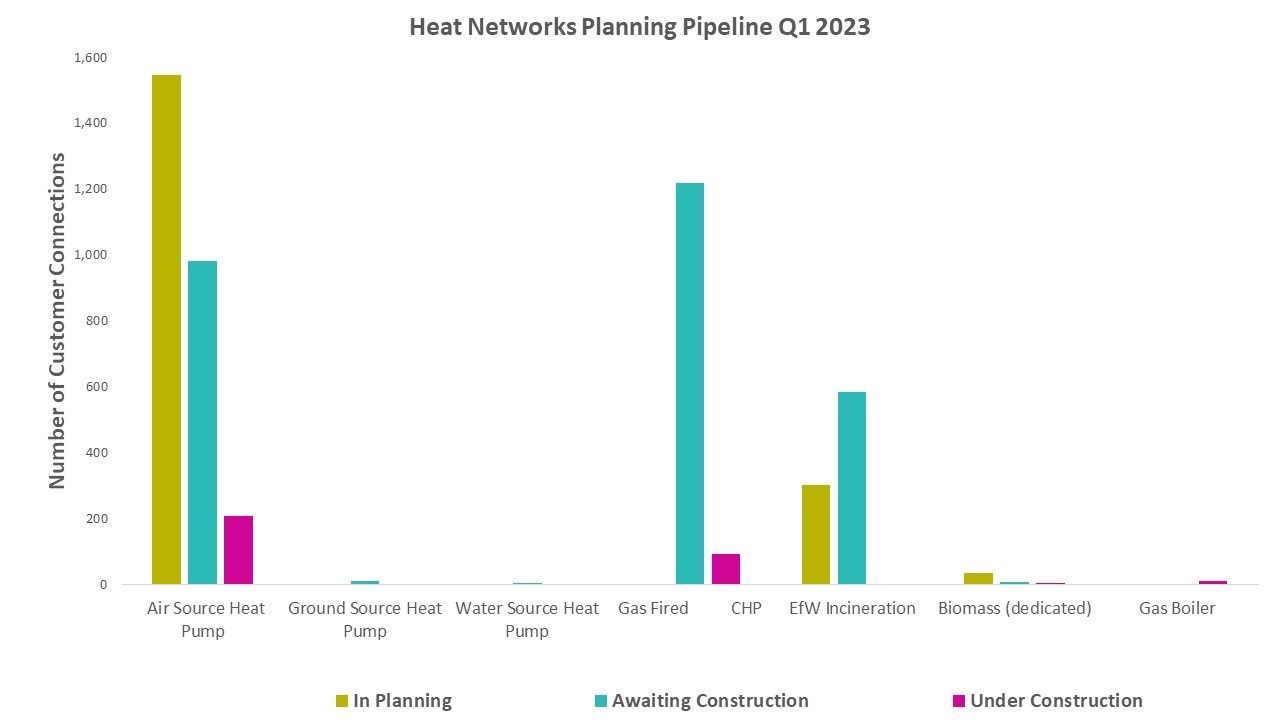
Source: Department for Energy Security and Net Zero - Heat Networks Pipelines
Wind project planning pipeline
Renewable energy projects must receive planning consent before construction can begin. Visibility of projects’ place in the planning process can aid supply chain companies which are looking to invest or upskill, so Scottish Renewables has made refined data from the UK Government for onshore wind and offshore wind projects in Scotland available here.
Data is updated quarterly in line with the UK Government’s schedule.
Emissions
Emissions displaced by Scotland's Renewable Electricity Output
Renewable energy is one of the best tools we have to combat climate change. As the proportion of renewable electricity in Scotland grows it gradually displaces the need to generate electricity from polluting fossil fuels, reducing total carbon emissions. The chart below sets out estimates of CO2 emissions displaced by renewables from 2011 to 2021.
Chart 8: Emissions Displaced by Scotland’s Renewables Electricity Output 2011-2021
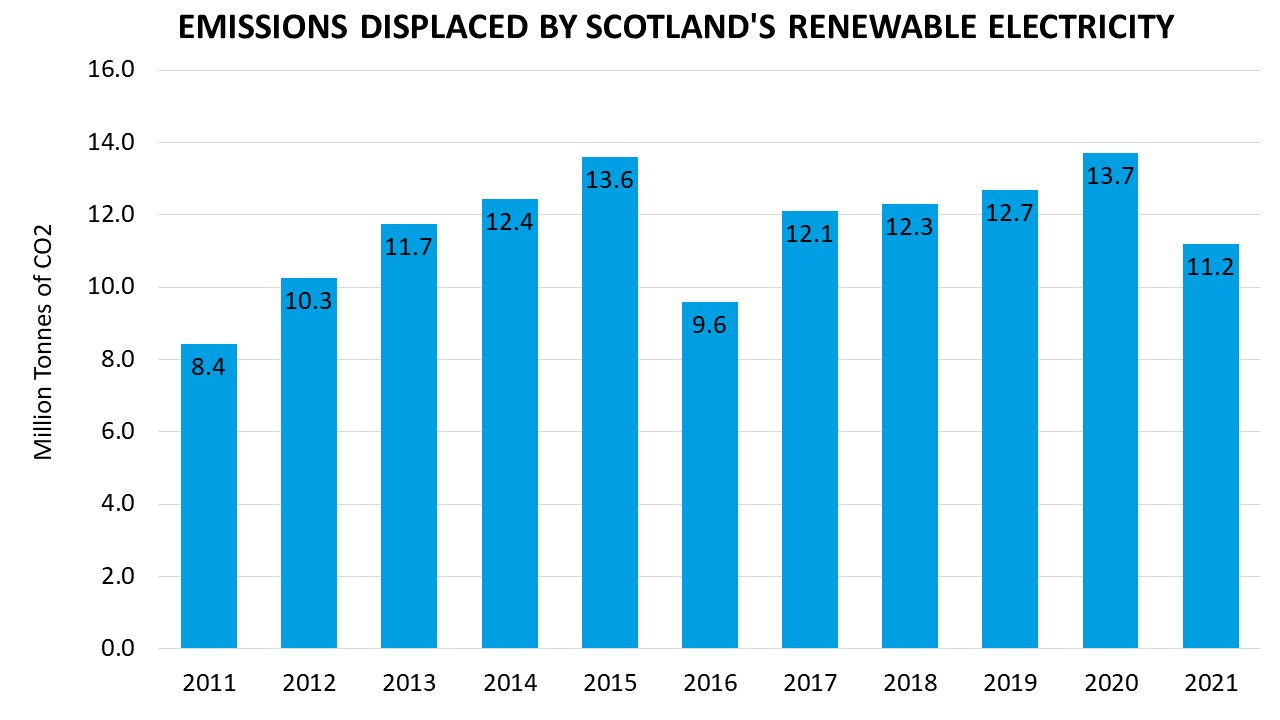
Source: Scottish Energy Statistics Hub
Heat
Chart 9 sets out the current mix of renewable heat generation capacity in Scotland. 2,140GW of renewable heat capacity was operational in Scotland by the end of 2020, up from 2.06GW in 2019 and 0.44GW in 2010. Biomass accounts for 81 per cent of the total capacity followed by heat pumps which account for 13 per cent of the total.
Chart 9: Renewable Heat Capacity by Technology in Scotland 2020
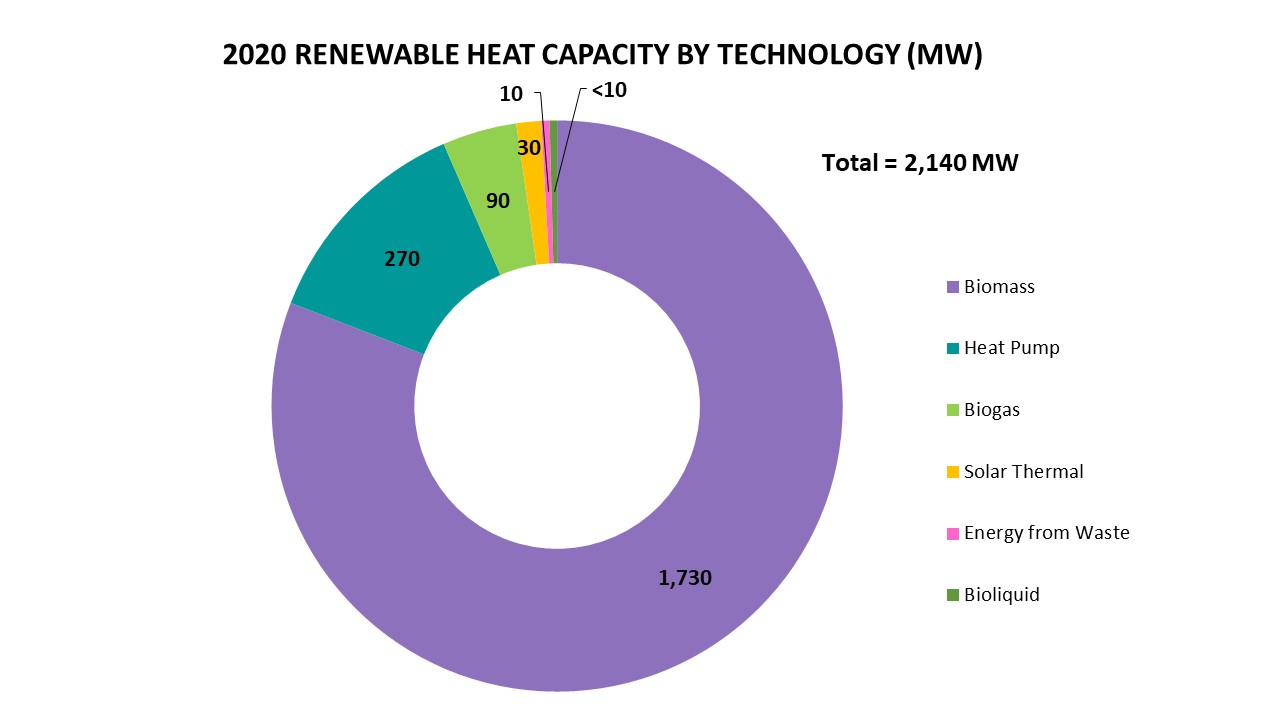
Source: Energy Saving Trust – Renewable Heat in Scotland 2020
Chart 10 shows renewable heat output by technology in 2020. In total, 5,008GWh of heat was produced from renewable sources; total renewable heat output has increased by 2 per cent from 2019.
Chart 10: Renewable Heat Output by Technology in Scotland 2020
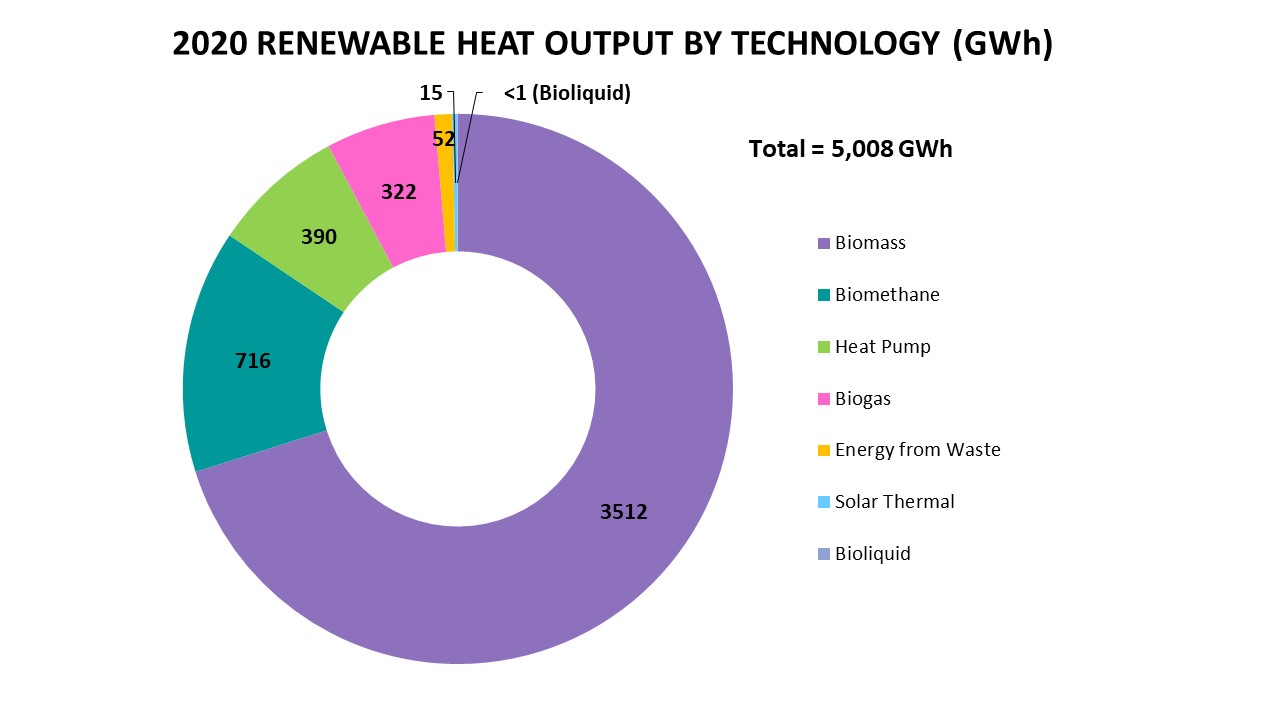
Source: Energy Saving Trust – Renewable Heat in Scotland 2020
Economy
Jobs
The Office for National Statistics (ONS) publishes an annual survey on the UK’s low-carbon and renewable energy economy, but in the past few years, this survey has included only direct activity. Scottish Renewables believes that the economic impact of renewables goes beyond direct activity so we’ve asked the University of Strathclyde’s Fraser of Allander Institute to conduct its own study, based on ONS figures, to estimate indirect and induced activity.
The latest report reveals that Scotland’s renewable energy industry and its supply chain supported more than 42,000 jobs and generated over £10.1 billion of output in 2021.
Chart 11 shows the breakdown of employment in 2021 across renewable energy in Scotland. This number includes direct, indirect and induced jobs.
Chart 11: Renewables Employment in Scotland, 2021.
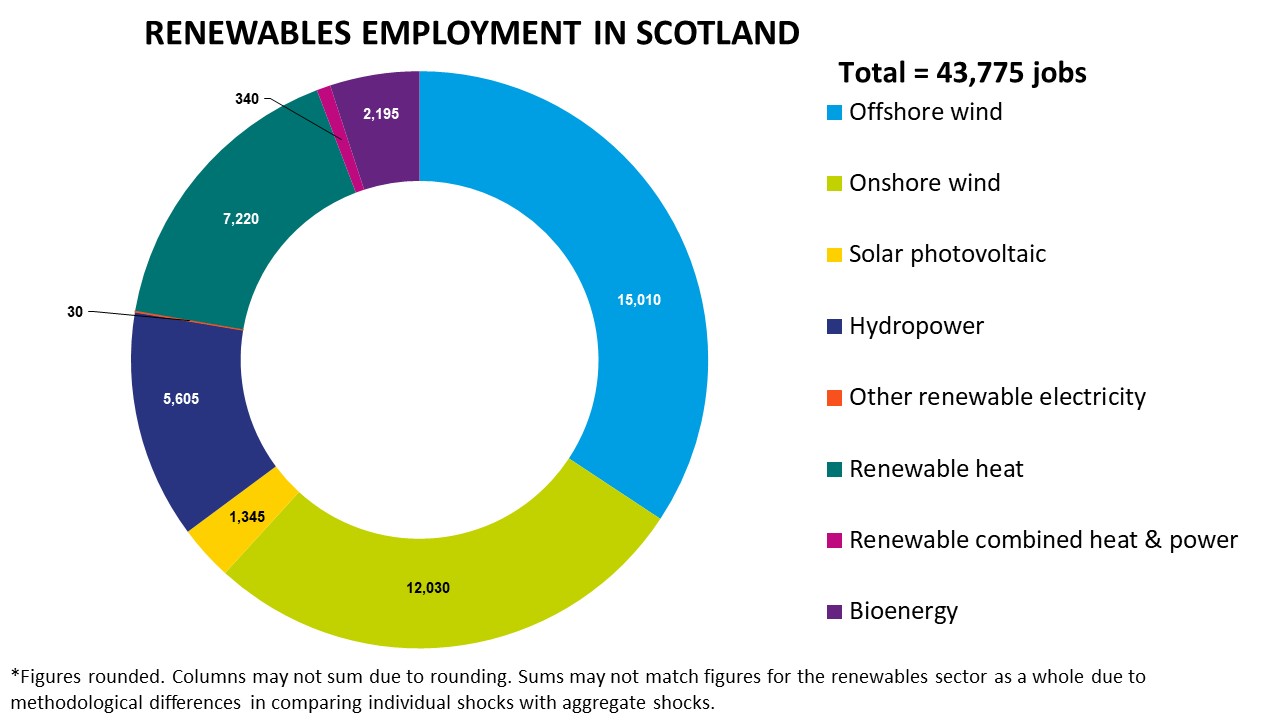 Source: Fraser of Allander Institute: The Economic Impact of Scotland's Renewable Energy Sector, 2022.
Chart 12 illustrates how the employment supported by the renewable energy industry was spread across different sectors of Scotland’s economy in 2021. We can see that construction supports the largest amount of employment, with other sectors such as manufacturing, and wholesale and retail services supporting large levels of employment too.
Chart 12: FTE employment supported by renewables in each industry in Scotland, 2021.
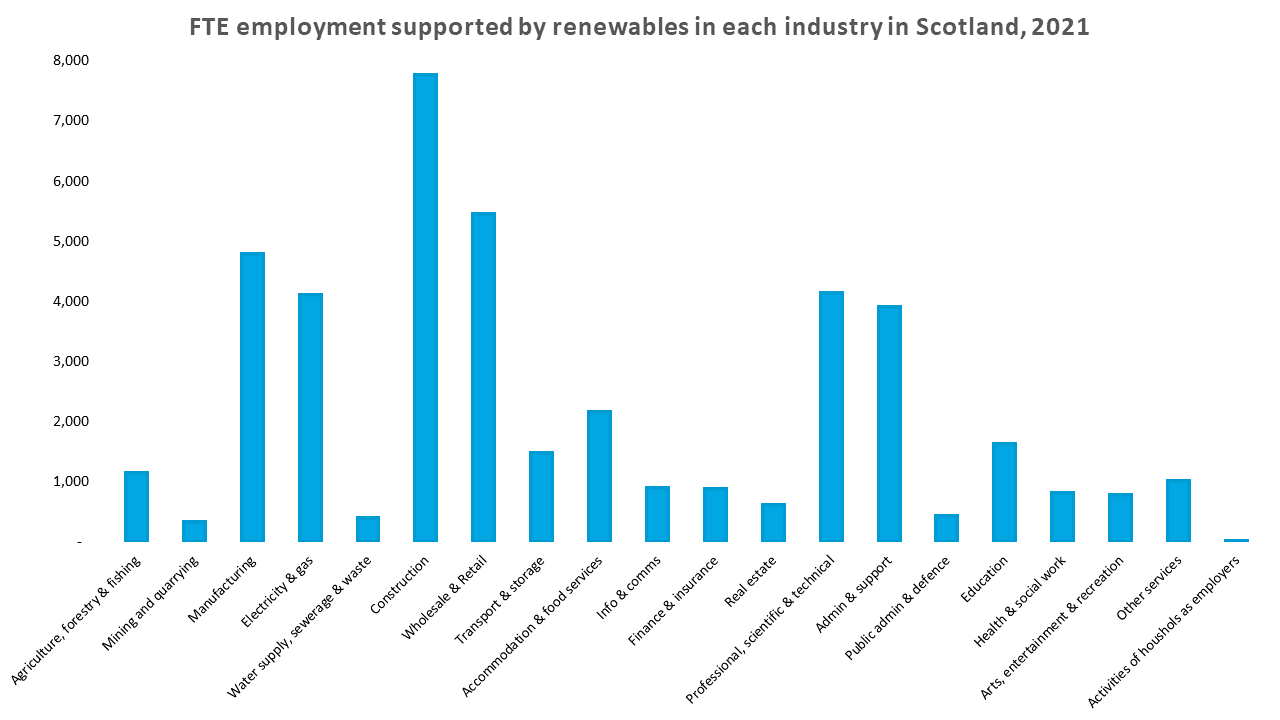
Source: Fraser of Allander Institute: The Economic Impact of Scotland's Renewable Energy Sector.
Economic contribution to national output
The chart below shows the outputs created by each renewable energy technology. We can see that the technology with the largest output is offshore wind, followed by onshore wind and renewable heat.
Chart 13: Renewables Output in Scotland in 2021.
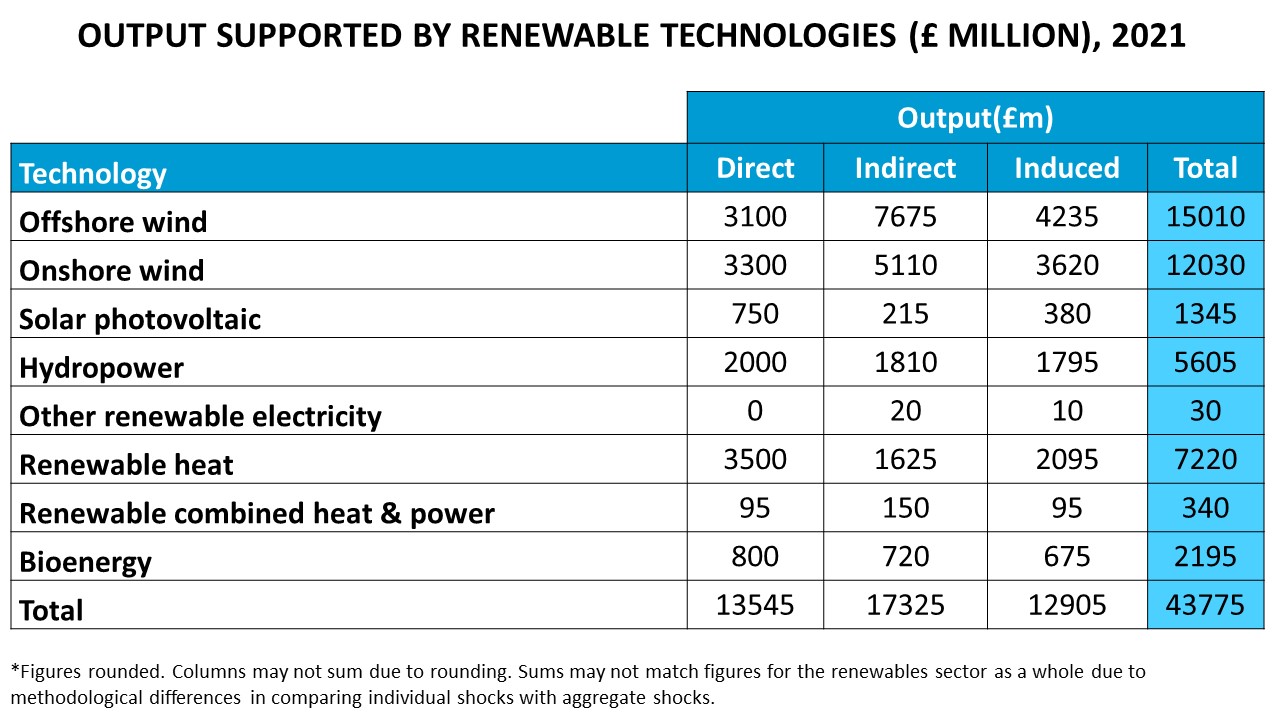
Source: Fraser of Allander Institute: The Economic Impact of Scotland's Renewable Energy Sector.